
Chapter 9: SVG polyline
SVG polyline, the “open sibling” of the <polygon> we just learned about!
Imagine we’re drawing with a pencil on paper:
- With <polygon> you draw a shape and the pencil automatically lifts and connects back to the starting point (closed loop).
- With <polyline> the pencil stays down and draws a continuous path through all points, but never closes the loop — it ends where the last point is.
This makes <polyline> perfect for things like:
- Zigzag lines
- Graphs / charts (data plots)
- Arrows without automatic closing
- Outlines that shouldn’t be filled
- Connecting dots in diagrams
- Isometric / technical drawings
Let’s break it down slowly, like always.
Main difference: <polyline> vs <polygon>
| Feature | <polyline> | <polygon> |
|---|---|---|
| Closes automatically? | No — open path | Yes — connects last point to first |
| Can be filled? | Yes (but usually looks strange) | Yes — normal closed shape |
| Best for | Lines, paths, outlines, charts | Filled shapes (triangle, star, house) |
| points attribute | Same format | Same format |
| Default fill | black (but often set to “none”) | black |
| Common use | Graphs, polylines in maps, arrows | Icons, buttons, geometric shapes |
Here are some clear comparison visuals showing open polyline vs closed polygon:

The only really important attribute: points
Exactly the same as <polygon>:
|
0 1 2 3 4 5 6 |
points="x1,y1 x2,y2 x3,y3 x4,y4 ..." |
- Space between each point pair
- Comma between x and y of the same point
- Minimum 2 points (otherwise nothing shows)
You almost always use these too:
- stroke — color of the line (default = black)
- stroke-width — thickness (default = 1)
- fill — usually “none” for open paths
- stroke-linecap, stroke-linejoin, stroke-dasharray — for nice endings & dashes
Example 1 – Simplest polyline (straight multi-segment line)
|
0 1 2 3 4 5 6 7 8 9 10 11 12 13 14 15 |
<svg width="400" height="220" style="border:1px solid #eee; background:#f9f9f9;"> <polyline points="40,180 120,60 200,160 280,80 360,140" fill="none" stroke="#2196F3" stroke-width="8" /> </svg> |
Result: A nice zigzag blue line — open at both ends.
Example 2 – Zigzag arrow (very common pattern)
|
0 1 2 3 4 5 6 7 8 9 10 11 12 13 14 15 16 17 |
<svg width="500" height="180"> <polyline points="40,90 140,90 140,40 240,90 140,140 40,90" fill="none" stroke="#F44336" stroke-width="12" stroke-linecap="round" stroke-linejoin="round" /> </svg> |
This creates a hand-drawn style arrow look — notice it doesn’t fill even though points repeat (because it’s not closed properly for fill).
Here is a zigzag arrow example for visual reference:
Example 3 – Dashed polyline (great for charts / timelines)
|
0 1 2 3 4 5 6 7 8 9 10 11 12 13 14 15 16 17 |
<svg width="460" height="200"> <polyline points="30,100 100,40 170,120 240,60 310,110 380,50 430,90" fill="none" stroke="#673AB7" stroke-width="6" stroke-dasharray="12 6" stroke-linecap="round" /> </svg> |
Example 4 – Filled polyline (looks weird — but sometimes useful)
|
0 1 2 3 4 5 6 7 8 9 10 11 12 13 14 15 16 |
<svg width="300" height="300"> <polyline points="150,20 280,140 220,260 80,260 20,140" fill="#FF9800" fill-opacity="0.4" stroke="#EF6C00" stroke-width="10" /> </svg> |
→ It fills the area as if it were closed — but because it’s open, the fill can behave strangely depending on direction and fill-rule. Most people avoid filling polylines unless they have a specific artistic reason.
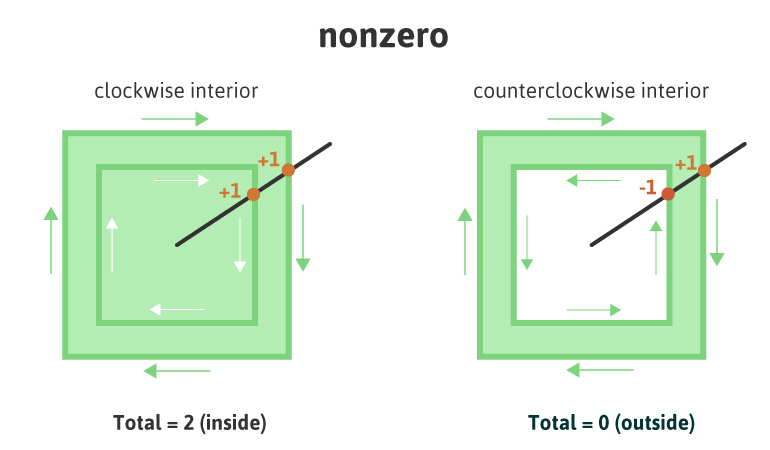
Here is a visual showing fill-rule behavior (helpful for understanding odd fills):
Example 5 – Polyline in a real diagram (simple chart-like feel)
|
0 1 2 3 4 5 6 7 8 9 10 11 12 13 14 15 16 17 18 19 20 21 22 23 24 25 26 27 28 29 30 |
<svg width="400" height="240" viewBox="0 0 400 240"> <!-- Background grid (using lines) --> <line x1="40" y1="200" x2="360" y2="200" stroke="#ddd" stroke-width="2"/> <line x1="40" y1="40" x2="40" y2="200" stroke="#ddd" stroke-width="2"/> <!-- Data polyline --> <polyline points="60,180 120,140 180,170 240,90 300,130 360,60" fill="none" stroke="#4CAF50" stroke-width="5" stroke-linecap="round" stroke-linejoin="round" /> <!-- Data points as small circles --> <circle cx="60" cy="180" r="6" fill="#4CAF50"/> <circle cx="120" cy="140" r="6" fill="#4CAF50"/> <circle cx="180" cy="170" r="6" fill="#4CAF50"/> <circle cx="240" cy="90" r="6" fill="#4CAF50"/> <circle cx="300" cy="130" r="6" fill="#4CAF50"/> <circle cx="360" cy="60" r="6" fill="#4CAF50"/> </svg> |
This is a very typical way people use <polyline> — for line charts!
Here is an isometric diagram example using many polylines for connections:

Quick Cheat Sheet – When to choose <polyline>
| You want… | Use this |
|---|---|
| Closed filled shape | <polygon> |
| Open path (no fill needed) | <polyline> |
| Single straight segment | <line> (simpler) |
| Curves + straight lines | <path> (most powerful) |
| Line chart / graph | <polyline> + circles |
| Arrow without closing loop | <polyline> + marker |
Common beginner mistakes
- Expecting it to close and fill nicely → use <polygon> instead
- Forgetting fill=”none” → weird filled area appears
- Only 1 point → nothing shows
- Points in wrong order → jagged / crossed look
Mini practice for you
- Draw a lightning bolt zigzag using <polyline>
- Make a simple mountain range silhouette (several peaks) with one polyline — fill it light blue
- Create an open arrow shape that doesn’t close (use stroke-linecap=”round” for nice ends)
Paste your code if you want feedback — I’ll review it like we’re sitting together debugging 😊
Any part still fuzzy? Which example should we expand or redraw? Just tell me — we’ll keep going until it’s super clear! 🚀


